




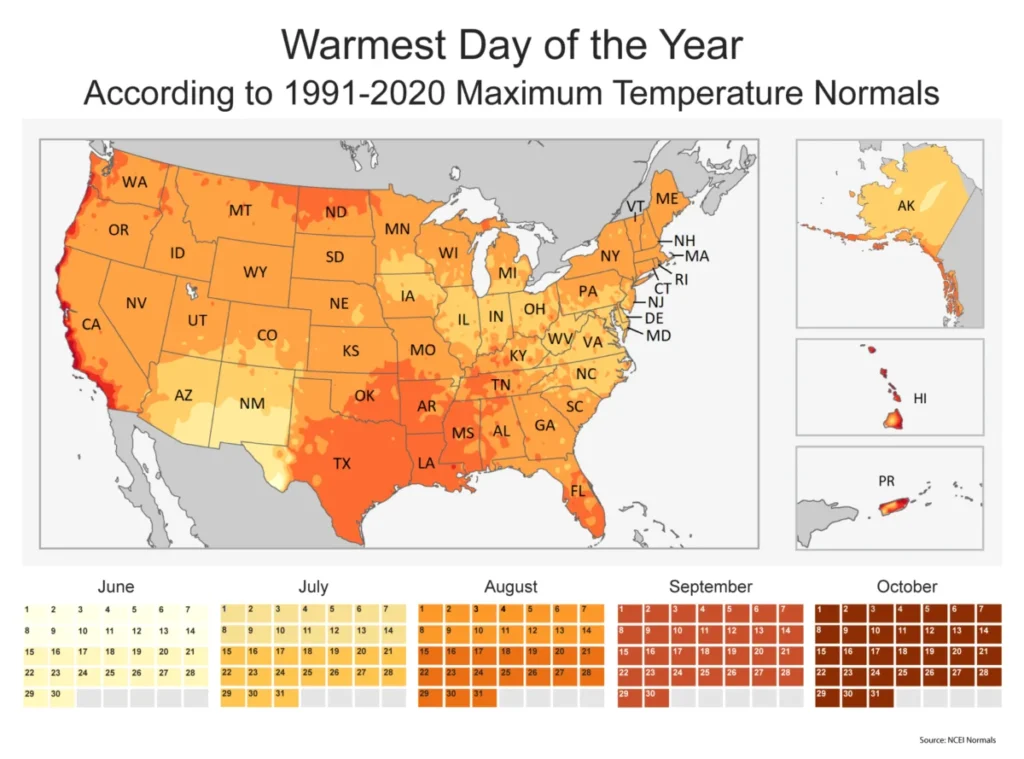
Historical meteorological data analyzed by the National Oceanic and Atmospheric Administration (NOAA) and the Old Farmer’s Almanac indicates that the "hottest day of the year" is not a uniform event across the United States, but rather a rolling phenomenon that spans from mid-June to late October depending on regional geography and atmospheric conditions. While the summer solstice in late June marks the point of maximum solar radiation in the Northern Hemisphere, the thermal response of the Earth’s surface and atmosphere typically lags behind, resulting in peak temperatures that vary significantly by state and coastline. This variance is driven by a complex interplay of soil moisture, prevailing wind patterns, and ocean temperatures, creating a distinct chronological roadmap for extreme heat that residents must navigate annually.
The Science of Seasonal Lag and Climate Normals
The phenomenon where the hottest days occur weeks or even months after the summer solstice is known as seasonal lag. Just as the hottest part of a day usually occurs in the mid-afternoon rather than at high noon, the hottest part of the summer occurs after the sun has begun its gradual descent in the sky. This is because the Earth’s surface—including the massive heat sinks of the oceans and the varying compositions of landmasses—continues to absorb more heat than it radiates back into space for several weeks following the solstice.
To determine when these peaks occur, meteorologists rely on "Climate Normals," a dataset produced by NOAA’s National Centers for Environmental Information (NCEI). These normals are updated every ten years and currently reflect the average weather conditions recorded between 1991 and 2020. This 30-year window provides a statistically significant baseline to help scientists and the public understand what constitutes "typical" weather in a specific location. The most recent data reveals that while July remains the primary month for peak heat across the majority of the U.S. landmass, the specific timing is shifting in response to broader climatic changes.
Regional Chronology: When the Heat Hits Home
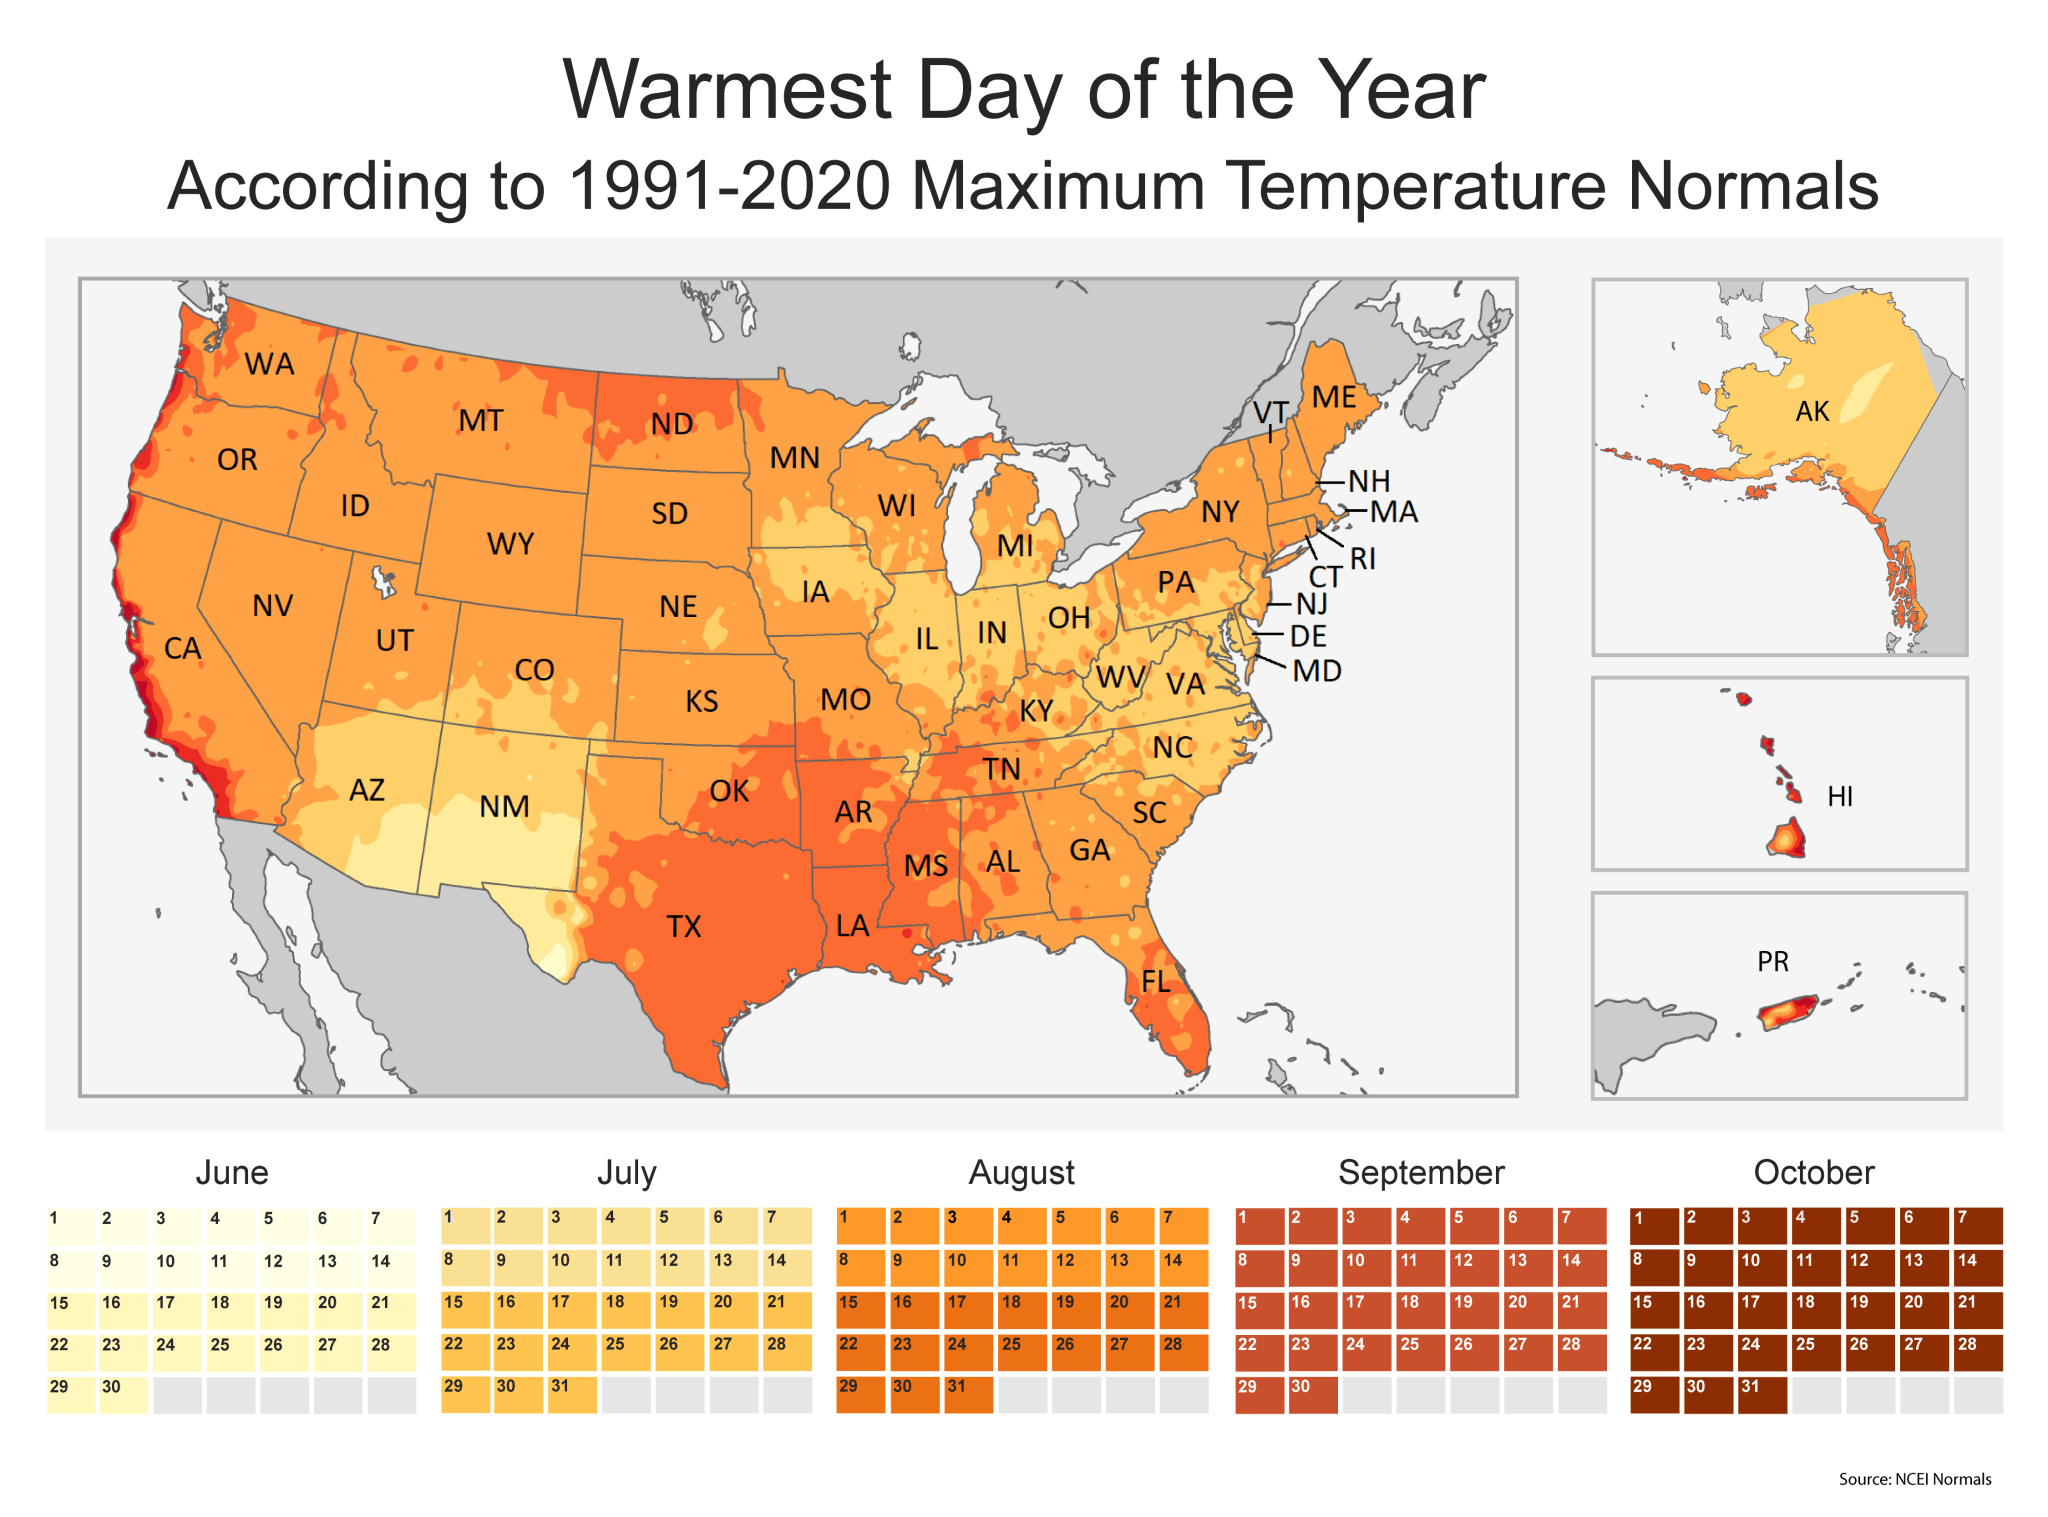
The progression of peak summer heat across the United States follows a predictable, yet geographically diverse, timeline. For the Desert Southwest, the hottest days often arrive earliest, sometimes in June or early July. This is largely due to the "North American Monsoon" pattern; as humidity rises in late July and August, the increased cloud cover and precipitation can actually lead to a slight cooling effect, meaning the dry heat of early summer often represents the annual temperature ceiling for states like Arizona and New Mexico.
In contrast, the vast majority of the Eastern United States, the Midwest, and the Great Plains experience their highest temperatures between mid-July and early August. In these regions, the buildup of humidity from the Gulf of Mexico and the gradual warming of the Great Lakes and the Atlantic Ocean create a sustained thermal mass. Cities such as Chicago, New York, and Washington D.C. typically see their record-breaking afternoons during this window, as the "heat dome" effect often stabilizes over the central and eastern corridors during the height of mid-summer.
The Deep South and the Gulf Coast—including Texas, Louisiana, Mississippi, and Alabama—often face a later peak, frequently extending into late August. The proximity to the Gulf of Mexico, which takes longer to warm than inland soil, means that the air remains slightly moderated in early summer but becomes stiflingly hot and humid as the Gulf waters reach their maximum temperatures in the late third of the season.
The Maritime Exception: Why the West Coast Waits
Perhaps the most striking anomaly in the U.S. heat calendar is found along the Pacific Coast and in the non-contiguous states of Alaska and Hawaii. For residents of California, Oregon, and Washington, the "hottest day" may not arrive until September or even October. This delay is attributed to the Pacific Ocean’s immense thermal inertia and the influence of the marine layer.
Throughout June and July, the cold California Current keeps coastal air temperatures relatively mild, often generating the famous "June Gloom" fog. It is only when the inland deserts begin to cool in the autumn, shifting pressure gradients and weakening the sea breeze, that the coastal regions experience their peak warmth. This often coincides with "offshore wind" events, such as the Santa Ana winds in Southern California or the Diablo winds in the North, which compress and heat the air as it descends from the mountains toward the coast.
Similarly, Hawaii and Puerto Rico see their highest temperatures in late summer and early autumn, as the surrounding tropical waters reach their thermal peak. In Alaska, the vastness of the state leads to a wide range of peaks, but many southern coastal areas follow the maritime trend of late-season warming.
Climate Change and the Shifting Baseline
While historical data provides a reliable guide, the acceleration of global climate change is complicating these traditional patterns. According to NOAA’s 1991–2020 data, the average temperature in the U.S. has risen significantly compared to the 1981–2010 period. This warming trend does not just mean higher absolute temperatures; it also means that heat waves are starting earlier and lasting longer.
Climate scientists note that the frequency of "extreme heat events" has increased steadily since the 1960s. The implications are twofold: first, the "hottest day" is becoming hotter, and second, the window of time in which a record-breaking day could occur is expanding. In some regions, what was once a mid-July peak is now being rivaled by heat events in late June or late August, effectively broadening the danger zone for heat-related illnesses and infrastructure strain.
The "Heat Dome" phenomenon has also become a recurring headline. This occurs when high-pressure atmospheric systems trap hot ocean air like a lid on a pot. These domes can cause temperatures to spike 20 to 30 degrees above normal for a week or more, often overriding the historical "average" hottest day for a specific zip code.
Socio-Economic Implications and Public Health
The timing of peak heat has profound implications for public policy, energy management, and agriculture. Electric grids, such as ERCOT in Texas or PJM in the Mid-Atlantic, must forecast peak demand with high precision to avoid rolling blackouts. As the hottest days shift or become more intense, the strain on air conditioning systems creates a feedback loop of high energy consumption and increased carbon emissions.
In the agricultural sector, the timing of the hottest day can determine crop yields. If peak heat coincides with the pollination phase of corn or the fruiting phase of citrus, the economic losses can reach billions of dollars. Farmers are increasingly relying on NOAA’s long-range data to select crop varieties that can withstand the specific heat timing of their region.
From a public health perspective, heat remains the leading cause of weather-related death in the United States, surpassing hurricanes, tornadoes, and floods. Organizations like the Centers for Disease Control and Prevention (CDC) use historical peak data to time their public awareness campaigns. Understanding that a city like San Francisco might face its most dangerous heat in October—long after the rest of the country has turned to autumn preparations—is vital for preventing heatstroke and protecting vulnerable populations such as the elderly and outdoor laborers.
Infrastructure and Urban Heat Islands
Urbanization has further complicated the historical data. The "Urban Heat Island" (UHI) effect—where pavement, buildings, and lack of vegetation trap heat—can make cities significantly hotter than surrounding rural areas. This effect can also delay the cooling process in the evening, meaning that the "hottest day" in a city like Phoenix or Las Vegas is characterized not just by the daytime high, but by the failure of the temperature to drop at night.
As municipalities look toward the future, many are using NOAA’s 30-year data to redesign urban spaces. This includes "cool roof" initiatives, the expansion of urban tree canopies, and the requirement for "cooling centers" to be operational during the specific windows identified by historical trends.
Strategic Preparedness for an Uncertain Future
The data provided by the Old Farmer’s Almanac and NOAA serves as a critical reminder that "summer" is not a monolithic season. It is a dynamic period of transition that affects different parts of the country at different times. As the 1991-2020 normals eventually give way to the 2001-2030 dataset in the coming decade, researchers expect to see a continued northward and later-season drift of peak temperatures.
For the average citizen, the takeaway from thirty years of meteorological data is one of preparation. Whether the peak arrives in the dry heat of a June afternoon in Tucson or the humid October air of a coastal California town, the necessity for hydration, energy conservation, and community check-ins remains constant. While we cannot change the trajectory of the sun or the thermal lag of the oceans, we can use the wealth of historical data available to mitigate the risks of an increasingly sweltering planet. The bottom line remains a call to resilience: as the climate evolves, so too must our strategies for enduring the season’s most intense conditions.